At Yes Investment Group, we offer a diverse range of services tailored to meet the unique needs of our clients. Before we can provide any of our specialised services, it is essential to complete a series of compliance checks. This ensures that we can offer solutions that are not only bespoke but also align perfectly with your individual requirements and investment goals. For more detailed information about our services and how we can assist you, please contact us for further information.
Algorithshortmic High Frequency Trading Our proprietary system uses multiple strategies to analyse and make trading decisions based upon term directional opportunities from multiple liquidity providers. Our performance is enabled by our infrastructure, which is comprised of A-Book STP connections to multiple liquidity providers with institutional-level latency, spreads and commissions provided by our partner brokers.
Low Drawdown in any Market Condition Our highest recorded drawdown is 0.8%, meaning at any point in time the balance of our account was at this level of maximum drawdown. We have also set an emergency hard stop of 5%. Our system operates consistently with low drawdown in bull, bear and ranging markets.
Risk Management
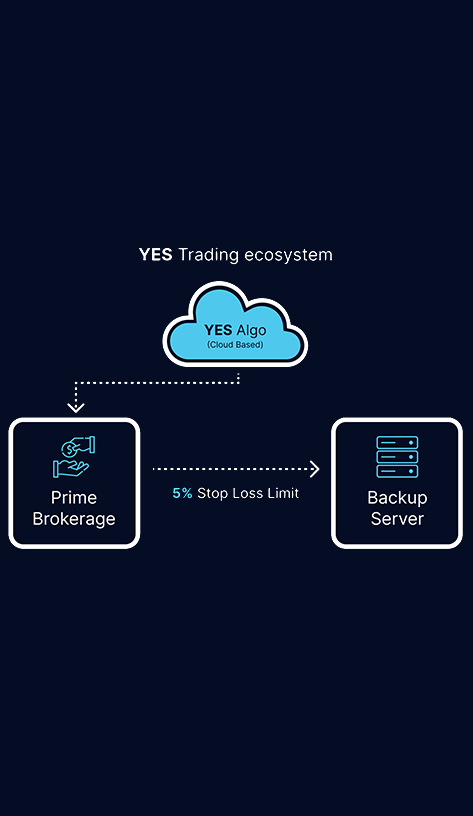
INFRASTRUCTURE
To mitigate any potential risk, there is a 5% emergency maximum risk limit in placed on a backup server which is independent to the trading algorithm in case of any unexpected hardware/ software problems, operational risks and black swan events. In the unlikely event of an emergency stop loss, all orders are closed. Our priority is to protect client capital under any circumstance.
All servers and operating systems are protected by Enterprise level and industry standard Microsoft Azure security protocols and software.
Strategy
High Frequency Tick Trading We operate with a High Frequency Trading strategy that takes advantage of micro-trends across major and minor pairs on the Foreign Exchange market using tick charts and multi time frame analysis.
Our entry signals are triggered by a confluence of unique price action patterns and proprietary indicators.